Gold & Hard Assets
Gold's role as a macro hedge, central bank buying trends, real yield dynamics, and the case for hard assets in a deglobalising world.
Current Situation
Last updated: October 03, 2026
Precious metals entered rare-event territory this week as gold and silver erased a combined $1.2 trillion in market value. Spot gold experienced a 3.4% daily drop, one of its steepest moves in two decades, driven by the 10-year Treasury yield hitting a 19-year high and energy-led inflation hardening the case for higher Federal Reserve rates. While gold eventually steadied around $4,186 following softer US PCE data, volatility remains extreme; gold futures have now recorded seven daily declines of 3.5% or more this year, the highest count since 2008.
Industrial metals diverged from the precious complex before rolling over late in the week. Copper initially held above $14,400 a ton, supported by strike risks at Chile's Centinela mine and a record September close of $14,875. However, dollar strength and oil prices exceeding $100 compressed demand, leaving copper on track for its biggest weekly loss since May and closing at $14,243.50. Palladium also declined, falling more than 3% to $1,161.93 an ounce.
Strategic consolidation and sovereign shifts continue to provide a structural floor. Gold Fields is considering a sweetened bid for Northern Star Resources after an initial $27 billion proposal was rejected, a move that would create the world's second-largest gold miner. Central bank demand remains robust, with July purchases 158% above pre-2022 averages and the Bank of Korea announcing its first gold purchase since 2013. Additionally, Burkina Faso opened its first gold refinery, signaling a broader African trend toward capturing more domestic value from minerals.
Investment implications shift toward a more cautious outlook for precious metals as Wells Fargo Investment Institute lowered its 2027 gold target range to $5,200–$5,400 from $5,400–$5,600. Short-term gains in gold are currently fragile and highly sensitive to Treasury yield fluctuations, while copper remains a play on physical scarcity and Chilean labor unrest versus macro headwinds. Investors should note the broadening commodity rally, with the Bloomberg Commodity Index up 37.3% year-on-year.
Key variable to watch: Whether US Treasury yields sustain their 19-year highs or retreat further, dictating if gold can recover its August peak.
Background
Gold's Role
Gold is the world's oldest store of value — a monetary asset that predates sovereign currencies by millennia. It has no yield, no cash flows, and no industrial use at scale (though jewellery and some electronics consume it). Its value derives entirely from the belief that other people will value it — a self-fulfilling monetary convention that has held for 5,000 years and shows no sign of breaking.
In the modern financial system, gold serves several roles simultaneously: an inflation hedge (though the empirical relationship is imperfect), a geopolitical risk hedge (it typically rises in crises), a dollar hedge (it moves inversely to the real value of the dollar), and increasingly, a reserve asset diversification tool for central banks seeking to reduce dollar exposure.
The 2024–26 period has been extraordinary for gold: prices broke above $2,000/oz in 2023, above $2,500 in 2024, and through $3,000 in 2025 — each level once considered a stretch target. The driver has been a structural shift: central banks, particularly those of BRICS nations (China, India, Russia, Turkey), have been buying gold at record rates as they deliberately reduce dollar reserve exposure. This is qualitatively different from prior gold bull markets driven by Western retail investors or ETF flows.
Drivers of Gold
Real Interest Rates: The most reliable medium-term driver. Gold's opportunity cost is the yield forgone by not holding TIPS (inflation-protected bonds) — the real interest rate. When real rates fall (either because nominal rates fall or inflation rises), gold becomes relatively more attractive and typically appreciates. The 2022 gold underperformance (when the Fed hiked aggressively, raising real rates) and 2023–26 outperformance (as real rates stabilised and the market priced future cuts) fit this framework well.
Central Bank Buying: The structural new buyer of this cycle. Central bank gold purchases reached 1,136 tonnes in 2022 and remained elevated through 2024–26. China has been the most significant buyer, adding hundreds of tonnes to its reserves while not disclosing the full extent of holdings. This buying is strategic — it reduces dependence on US dollar reserves and the risk of sanctions (Russia's experience, where $300B in dollar reserves were frozen, accelerated the trend dramatically).
Dollar: Gold is priced in dollars, so a weaker dollar mechanically raises the dollar gold price. Beyond mechanics, a weak dollar often signals that the monetary conditions driving gold demand (loose policy, inflation risk) are present.
Geopolitical Risk: Wars, sanctions, and systemic financial stress drive gold as a safe-haven asset. The Ukraine war and the freezing of Russian reserves were particularly powerful catalysts — they demonstrated that dollar-denominated assets could be confiscated, making physical gold (which cannot be seized remotely) more attractive.
ETF Flows: The introduction of gold ETFs in 2004 (GLD was the first major one) democratised gold investment. ETF holdings provide a good measure of Western investor sentiment. The current cycle is notable for strong price appreciation even without major ETF inflows — indicating the central bank and Asian buying is the primary driver.
Silver and Precious Metals
Silver has a dual nature — part monetary asset (trades alongside gold), part industrial metal (used in solar panels, electronics, photography). This dual demand makes silver more volatile than gold with higher beta to the gold price in bull markets and deeper drawdowns in bear markets. The gold-silver ratio (currently around 80–90x) measures the relative valuation — historically it has ranged from 15x to 120x.
Platinum and palladium are primarily industrial metals (catalytic converters in internal combustion engine vehicles) with much smaller investment markets. Palladium's price boom (2018–2021) and subsequent collapse illustrates how quickly a supply deficit can reverse when demand (ICE vehicles) falls.
Historical Context
1944 — Bretton Woods (Gold at $35/oz): Gold was fixed at $35/oz as the anchor of the Bretton Woods system. All currencies were pegged to the dollar; the dollar was pegged to gold. The US accumulated the world's largest gold reserves.
1971 — Nixon Shock: Nixon ended gold convertibility, floating the dollar. Gold was freed to find its market price. It surged from $35/oz to $850/oz by 1980 — a 24x increase driven by the 1970s inflation shock.
1980–2000 — Two Decade Bear Market: Gold fell from $850 to $250/oz as Volcker's tight monetary policy crushed inflation, real rates rose, and the long equity bull market made financial assets more attractive. Central banks (including the UK under Gordon Brown) sold gold reserves at the bottom.
2001–2011 — First Modern Bull Market: Gold rose from $250 to $1,900 — driven by dollar weakness (US ran large deficits post-9/11), emerging market central bank buying, and the 2008 financial crisis. The GFC drove the "system risk" safe-haven premium to extremes.
2020–Present — New Bull Market: Gold broke to new all-time highs in 2020 (COVID crisis), consolidated, then launched into a new leg driven by the factors described above — central bank buying, Russia sanctions, dollar diversification, and real rate dynamics.
Market Exposure
Gold Spot / Futures: COMEX gold futures (GC) are the primary market. Settlement can be in cash or physical delivery. The futures price closely tracks spot.
Gold ETFs: GLD (SPDR Gold Trust) and IAU (iShares) are the largest gold ETFs, holding physical gold in trust. They provide equity-like access to gold price exposure without storage or insurance costs.
Gold Miners: GDX (VanEck Gold Miners ETF) and GDXJ (junior miners) provide leveraged exposure to the gold price — gold miners' profitability is highly sensitive to the spread between gold price and their all-in sustaining costs (typically $1,000–1,300/oz). When gold is $3,000, miners generate extraordinary margins; when gold is $1,200, they barely break even. Individual major miners: Newmont, Barrick, Agnico Eagle, Gold Fields.
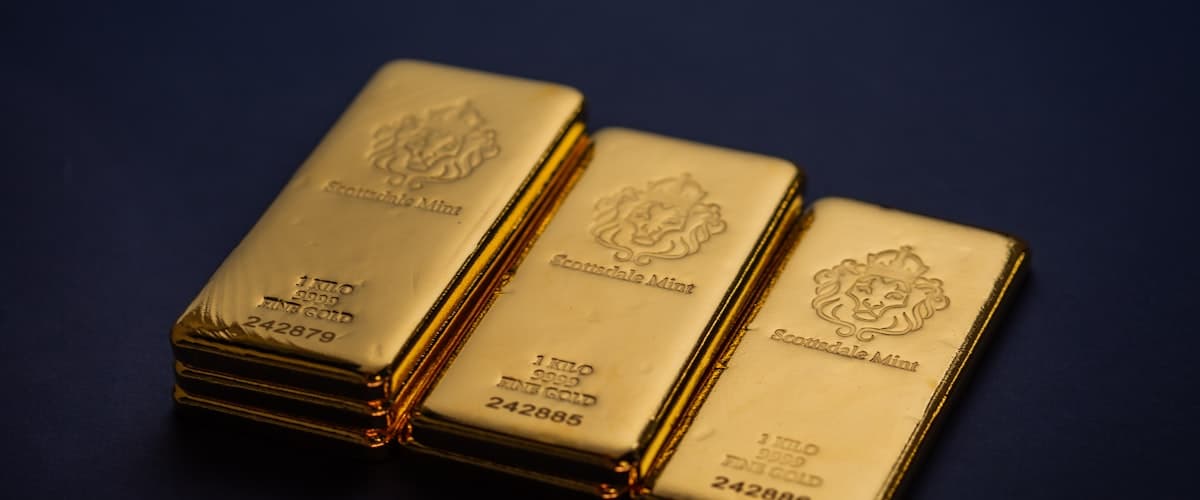
Physical Gold: Allocated accounts at bullion banks, coins (Krugerrand, American Eagle, Maple Leaf), and bars. The premium over spot reflects storage, insurance, and liquidity costs. The LBMA (London Bullion Market Association) is the primary OTC market for large transactions.
Silver (XAG/USD): Trades as a higher-beta, lower-liquidity cousin of gold — same monetary/safe-haven drivers, amplified moves in both directions, plus an industrial-demand layer from solar panel manufacturing that gold doesn't have. The gold/silver ratio (how many ounces of silver equal one ounce of gold) is the standard relative-value gauge between the two.